Download this note (PDF)
There are many reasons to love dairy products like milk, cheese, yogurt etc. They are a powerhouse of essential nutrients and are a convenient and cost-effective source of protein. Recently grocery aisles have been flooded with different “high protein” dairy products, where extra protein is added. If you are like us, you might have wondered how much more protein do the high protein dairy products have.
We offer analytical services to precisely detect a broad range of biomolecules like amino acids, vitamins etc. in cell culture media and food. We have used our analytical platform previously to measure different vitamins in juices. We decided to test dairy products, for their protein content. We went to a local grocery store and bought one package of various dairy products. Using our proprietary total amino acid determination method, we tested various high protein products and compared them to conventional dairy products. We measured all samples four times and present here the average amount.

Figure 1: Typical dairy aisle in a grocery store.
As advertised, nutrient analysis of high protein dairy products showed increased protein content compared to unsupplemented regular yogurt which had about 2.7% protein by weight.
Products like Skyr (a yogurt-like product of Icelandic origin made from curdled milk) and curd (also called dry curd cheese or farmer’s cheese or pot cheese) unsurprisingly comprise high amounts of naturally occurring protein, with low fat curd cheese showing the highest protein amount (~ 12%) of all tested products. As for protein supplemented dairy products, our protein analysis platform showed that the highest protein amount was in a leading brand of high protein vanilla pudding at about 10.5% of protein by weight.
The amino acid analysis of the selected dairy products showed that most protein values were close to the advertised values on the nutrient table present on the packaging. In our protein assays, four dairy products showed deviations larger than 20% from the nutrient table on the package. They were – high protein rice pudding, high protein semolina pudding, Bio Skyr (a probiotic Skyr) and yogurt.
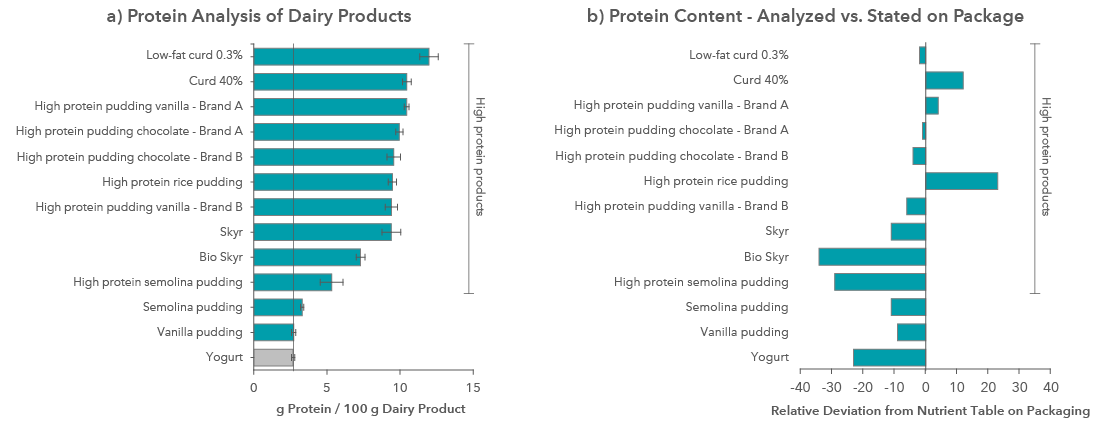
Figure 2: Each product was tested four times for its protein content. a) Shown are the mean protein values; and b) relative deviations of measured protein value from value stated on package.
The high-protein dairy products indeed had higher protein than regular yogurt. Protein estimates for four dairy products had close to 20% deviation from the nutrition label. Many factors could explain this discrepancy. We could have inadvertently picked a non-representative batch; presence of grains affected the sample preparation; sampling of yogurt was not consistent. Since the standard deviations in our measurements are very tight (see Figure 2a) sampling errors are less likely.
There are various methods for measuring protein content in dairy products (see box) and the differences in measured protein vs. protein content stated on label could be due to different assays. The Kjeldahl method (see box) is the official analytical method according to German food legislation and it measures both organic and inorganic nitrogen. Xell’s method measures amino acids and not total nitrogen, so some of the discrepancies could be due to different methods used. These results do not in any way question the integrity of the packaging labels. Rather they show that the end user needs to account for multiple factors while doing nutritional analysis of food.
In our protein determination the highest protein content was found in naturally protein rich dairy products like curd cheese with a protein content of approximately 12%.
Enhanced protein desserts like high protein vanilla pudding were close to the curd cheese at about 10.5% of protein by weight. Both the naturally high protein dairy products and the enhanced protein dairy products could be a good source of protein in food.
As you contemplate these results while enjoying your high protein dairy snack do remember that we have been offering analytical services for nutritional analysis of food and feed for over 10 years. Our clients have used our analytical services to do spent media analysis in their bioprocess, or estimate biomolecules of interest in their food.
Feel free to reach out to our scientists directly or visit our webshop to see if we can assist you with your analytical needs.
Various protein determination methods for dairy products
Xell’s proprietary amino acid determination method: We perform hydrolysis of all proteins inside the samples and then quantify the amino acid composition using HPLC analysis. By calculating the amount of each amino acid, we can precisely determine the protein content. The advantage of our method is that we can determine total protein content, since during hydrolysis all proteins become available for measurement (even bound in solid parts).
Kjeldahl process is a method of determination of nitrogen in foods by acid hydrolysis. This process measures nonprotein nitrogen in addition to nitrogen in proteins so it does not give a measure of true protein content.
The Dumas method is a process of determination of nitrogen in foods by rapid combustion of a sample in the presence of oxygen and at very high temperatures. This leads to release of substances such as carbon dioxide, water, and various oxides of nitrogen. Like the Kjeldahl process the Dumas method does not give a measure of true protein content.
Casein determination is based on precipitation of casein at pH 4.6. The precipitated milk casein is removed by filtration and the nitrogen content of either the precipitate (direct casein method) or filtrate (noncasein nitrogen) is determined by Kjeldahl analysis. Since casein is the most abundant protein in milk it offers a good approximation of protein content of dairy products. But it is not a total protein measurement.
Spectroscopic methods like Biuret, Lowry and Bradford are also used to measure protein content. Biuret and Lowry are based on reaction of protein with copper resulting in colored compounds while Bradford measures the blue color from the Coomassie dye-protein complex. These methods could have difficulty in assaying protein that is bound to solid parts and therefore inaccessible to the reaction media.